Capturing and improving the “Lead2Cash” Journey
In the previous paper, it was indicated that the Lead2Cash journey can vary, depending on the type of business.
Let us assume for a moment that a company provides both off-the-shelf products, can design new products and services to meet customer’s requirements, and also provides product and service support.
Having undertaken a review of its’ “AS-IS” processes, a simple diagram (see below) is derived, showing how the business has decided to break its “Lead2Cash” journey into sub-process ‘chunks’. This diagram also shows how different parts of the journey are linked (for simplicity, not all links are shown, just the key ones).
This diagram clarifies the end-to-end relationships and allows us to ask interesting questions about the process and how it might be improved.
Lead2Cash Journey
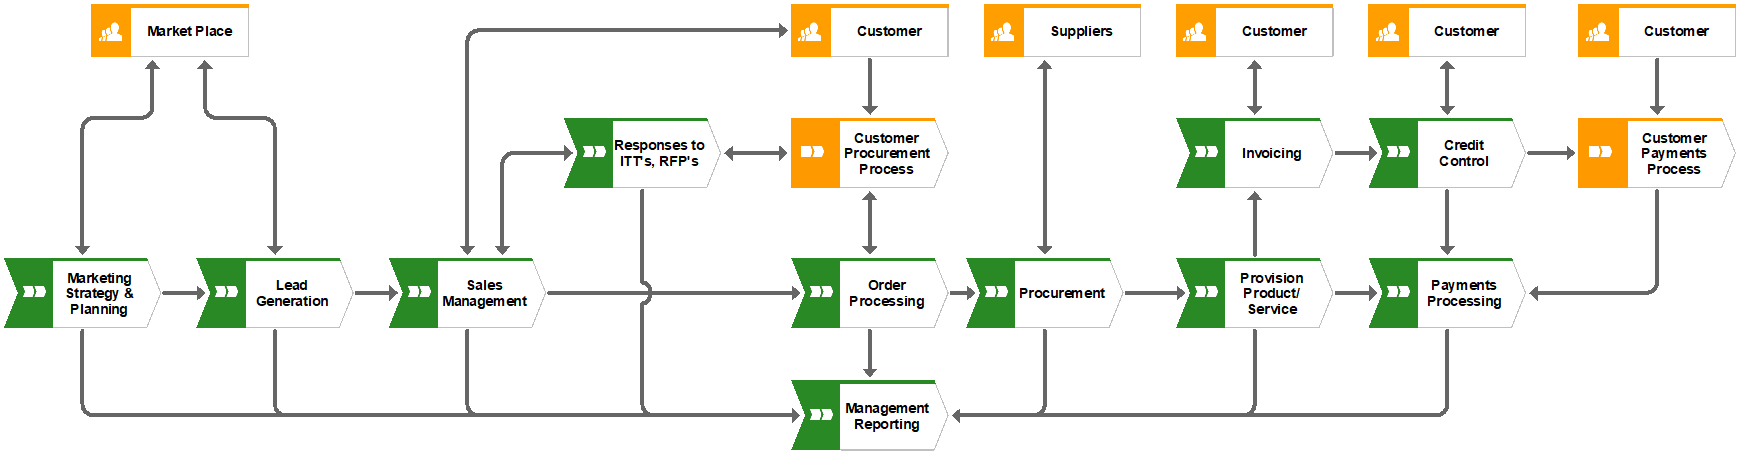
We can easily identify specific relationships; for example:
- Marketing Planning may drive the need for products and services for existing or new markets, triggering the need for investment in developing those new products and services.
- Marketing Planning also drives lead generation, which might initiate putting together a Bid or responding to customer’s requests based on an ITT, RFP or RFQ.
- Lead Generation feeds into order processing, which may require Procurement of parts or materials, which once received are put into stock, under the stock management processes.
Each sub-process feeds one or more sub-processes as the journey continues. What is clear, is that there is not one route only from a lead to getting paid.
What the diagram doesn’t show, at this level of detail, are the outputs from the separate sub-processes or what work is undertaken within each Sub-Process, however, it does allow greater understanding of the overall journey (just as a roadmap doesn’t show you all the road signs).
Assuming Leads turn into orders, there is a process for receiving an order, checking it against specifications; contract terms, acknowledging the order and confirming delivery dates. Order Processing may also check stock availability and, where necessary, trigger procurement of stock or thirdparty services (e.g. using an external delivery company).
Developing a new product or service can be a complex activity and is not covered as part of this paper.
Assuming the business is delivering an existing product or service, this will be planned and provisioned based on availability of stock, resources (typically materials, equipment, people) and contractual requirements. Delivery/Despatch may be performed internally or by external resources. In many businesses, this is the point at which the invoice would be sent to the customer however it may also be initiated at the point where the order is taken, in which case the journey shown above will be different.
Many companies fail to track whether their customers make payments on time; this can have a critical impact on cashflow, so it is essential that some form of credit control is put in place, together with a mechanism for processing payments.
So now we have a clear high-level view of the “Lead2Cash” journey. Does it work well? To know this, we have to measure the four critical indicators, namely Time, Cost, Quality and Quantity.
Key Results Areas (KRAs) and Key Performance Indicators (KPIs)
In the previous paper, we saw how the “Lead2Cash” journey might be structured in terms of the sub-processes that make up the journey. Examination of the possible routes shows that there is no one simple route because the route taken depends on the customer’s requirements.
A couple of alternative routes might be as follows:
- Response to ITT/RFP/RFQ, Order Processing, Order Management, Product/Service Provisioning, Delivery/Despatch, Invoicing, Credit Control, Payment Processing, Management Reporting.
- Marketing Planning, Lead Generation, Bid Management, Order Processing, Order Management, Product/Service Solution Design, Product/Service Provisioning, Delivery/Despatch, Invoicing, Credit Control, Payment Processing, Management Reporting.
We can see from this, that whilst there are common sub-processes involved, the key measures will depend on the path taken. So how do we cope with this? The solution is to take each sub-process and identify the measures that are critical to that sub-process. We call these Key Performance Indicators or KPI’s.
Bear in mind that there will be variation in the time, costs, quality and number measured in each sub-process. This is because it never takes the same time, or costs the same, or produces the same quality, or processes the same number each time a process is followed.
Knowing the variation in these indicators allows a business to understand what the overall measures are for any particular “Lead2Cash” journey. This allows for better control of the business and can prevent a business from making promises it cannot keep (e.g. promising a delivery date when there is no realistic way all the sub-processes can be followed properly to deliver on that date). If the business does not know the capability of its processes, Time, cost, quality or quantity will usually be compromised.
So, let’s take a sub-process (say Order Processing) and see how it might be broken down into meaningful steps. All processes will have the following activities:
- Planning/Re-Planning
- Doing/Re-Doing
- Checking/Re-Checking
- Acting/Re-Acting
All processes have entry points and exit points, they use resources (such as people, technology, money, time, materials, data). Processes ultimately have to produce something (the product or service) and, in addition, will produce information about what has happened in the process (records, such as reports, charts, information, evidence of activities).
A simplified view of a process could be as in the diagram below:
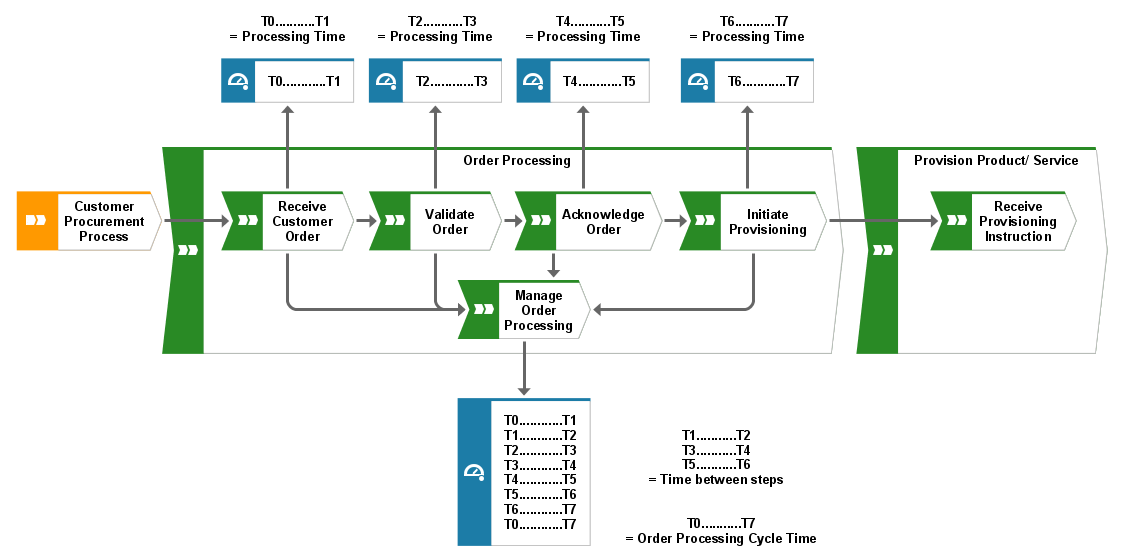
Note that here we are looking at the time intervals for each step in the process (e.g. T0-T1, T2-T3, …) and the time intervals between the steps (e.g. T1-T2, T3-T4.). The time intervals between steps typically occur when work is passed from one person or step in a process to another and, when totalled, can have a major contribution to the overall total time taken to pass through the process. This is where most of the delays are likely to be. These may be down to the next person in the chain being busy or to delays in the way in which the work is passed on (email, ERP system, internal post, placed in an in-tray, hand-delivered.). Remember that time is money. The amount of time taken can have a significant impact on the overall cost of processing an order.
We can do the same for the costs of each step. Each step requires people technology, materials and parts. When we start to total these, we can see where the major costs are in a process and then look at ways of bringing them down.
Quality can be less easy to measure as there is sometimes a level of subjectivity in how it is measured. Consider “Customer Satisfaction”. How to measure this? We can ask customers, but the reality is that not all customers are interested in providing the information in a meaningful way. In other cases, it is easy to measure, for example, the percentage pass/fail rate of a production process.
Number is the final measure; we can measure the number of orders received per day/per market sector. We could also measure the number of orders that are accepted and the number rejected. Rejections or failures in a process require additional work, hence increasing costs, but without the benefit of corresponding income.
One thing to beware of is trying to measure everything. What is important to management are the critical measures of business performance (the KPI’s), linked to the Key Results Areas (KRA’s) or the objectives of the business.
If we take the Order Processing example above, the measures that interest management might be as follows:
- Number of Orders by product (or customer, or market sector)
- Value of Orders by product (or customer, or market sector)
- Order Processing Time (T0-T7)
- Cost to process an order
- Percentage of Orders processed without problems
Once we know these measures, we can track them, analyse them and then determine what actions to take (if needed) to improve the process.
Conclusions
In conclusion, what are the key actions needed by an organisation to improve its “Lead2Cash” journey?
- Identify responsibility for improving the “Lead2Cash” journey.
- Commit resources.
- Capture the AS-IS process (Including all sub-processes).
- Identify pain points, areas of weakness and Time, Cost, Quality and Quantity).
- Re-design the (TO-BE) process (Including simulation to determine Best Practices.)
- Implement the improved process.
- Monitor performance (KPI’s) and initiate Continuous Improvement.